Market Outlook
May 17, 2017
Market Cues
Domestic Indices
Chg (%)
(Pts)
(Close)
Indian markets are likely to flat tracking the SGX Nifty and Asian markets.
BSE Sensex
0.9
260
30,583
The tech-heavy Nasdaq closed at a record for a second session in a row Tuesday as
Nifty
0.7
67
9,512
the Dow industrials and S&P
500 finished fractionally lower amid political
Mid Cap
0.3
40
15,080
uncertainty in the U.S. The S&P 500 index declined 0.1%, to finish at 2,401 while the
Small Cap
0.4
159
15,710
Nasdaq Composite Index rose 0.3%, to end at a record 6,170. The Dow Jones
Industrial Average slipped less than 0.1%, to close at 20,980.
Bankex
0.5
131
26,059
The benchmark stock index in UK set another record high on Tuesday, passing
Global Indices
Chg (%)
(Pts)
(Close)
7,500 for the first time ever to place it on track for a record close. The FTSE 100
started the morning slowly but extended its gains through the day.
Dow Jones
(0.0)
1(2)
20,980
Nasdaq
0.3
20
6,170
Indian markets soared to record-smashing heights for the second straight session on
Tuesday as investors remained enthused by the early onset of monsoon amid
FTSE
0.9
68
7,522
quarterly earnings cheer. Benchmark Sensex finished at a fresh lifetime high of
Nikkei
(00.3
50
19,920
30,583 while the broader Nifty closed above the 9,500-mark for the first time.
Hang Seng
(0.1)
(36)
25,336
Shanghai Com
0.7
23
3,113
News Analysis
Glenmark anti-myeloma drug gets clinical trial nod from USFDA
Advances / Declines
BSE
NSE
Detailed analysis on Pg2
Advances
1,420
1,878
Investor’s Ready Reckoner
Declines
1,376
806
Unchanged
181
74
Key Domestic & Global Indicators
Stock Watch: Latest investment recommendations on 150+ stocks
Refer Pg6 onwards
Volumes (` Cr)
BSE
4,986
Top Picks
NSE
24,873
CMP
Target
Upside
Company
Sector
Rating
(`)
(`)
(%)
Blue Star
Capital Goods
Accumulate
677
760
12.2
#Net Inflows (` Cr)
Net
Mtd
Ytd
Dewan Housing Fin. Financials
Buy
424
520
22.5
FII
(56916
( 2,319
44,331
Mahindra Lifespace Real Estate
Buy
452
522
15.5
Navkar Corporation Others
Buy
235
265
12.6
MFs
(720)
2,655
23,337
KEI Industries
Capital Goods
Accumulate
220
239
8.4
More Top Picks on Pg4
Top Gainers
Price (`)
Chg (%)
Unitech
196
11.1
Key Upcoming Events
Previous
Consensus
J&Kbank
89
8.7
Date
Region
Event Description
Reading
Expectations
Adanipower
33
8.6
May 17, 2017 US
Initial Jobless claims
236.00
240.00
Kec
248
7.3
May 17, 2017 Euro Zone Euro-Zone CPI (YoY)
1.90
1.90
May 18, 2017 UK
Jobless claims change
25.50
Indhotel
144
5.2
May 19, 2017 Euro Zone Euro-Zone Consumer Confidence
(3.60)
(3.00)
May 23, 2017 Germany GDP nsa (YoY)
2.90
Top Losers
Price (`)
Chg (%)
May 23, 2017 US
New home sales
621.00
625.00
Cholafin
1,017
(3.1)
More Events on Pg5
Il&Fstrans
114
(2.9)
Kajariacer
696
(2.8)
Godrejcp
1,876
(2.6)
Bharatfin
791
(2.4)
#As on May 16, 2017
Market Outlook
May 17, 2017
News Analysis
Glenmark anti-myeloma drug gets clinical trial nod from USFDA
Glenmark has indicated that it has received got clearance from the US health
regulator for its investigational new drug application to initiate phase-I study of
GBR 1342, a humanised monoclonal antibody for treatment of multiple myeloma.
This is Glenmark's second investigational new drug from its immuno-oncology
portfolio to enter clinical trials.
GBR 1342 is designed to activate the patient's immune system by redirecting
immune cells towards tumour tissue, which may lead to targeted destruction of
tumours. It is based on Glenmark's proprietary BEAT (Bispecific Engagement by
Antibodies based on the T cell receptor) technology platform. The first-in-human
phase-I study of GBR 1342 will enrol subjects with multiple myeloma who have
exhausted available therapies.
Glenmark shares have underperformed the market in this calendar year. In CY17,
the stock has seen -23% returns while markets have made a new high. The stock is
currently available at 14x of its FY19 consensus earnings.
Economic and Political News
UN lowers India GDP growth forecast for 2017 to 7.3%, cautions on bad
loans
Seven months in, Monetary Policy Committee finally gaining currency for
independence
GST exemption likely for around 100 items
PM to pitch for higher foreign investments into India
Centre to pay out Rs 1 lakh crore via direct benefit transfer scheme in 2017-
18
Corporate News
TCS gets structural makeover with renewed focus on going digital
18% growth in FY17 an aberration: HDFC Bank
Airtel-Tikona deal: Reliance Jio asks telecom dept to withhold clearance
Market Outlook
May 17, 2017
Quarterly Bloomberg Brokers Consensus Estimate
United Breweries Ltd - May 17, 2017
Particulars ( ` cr)
4QFY17E
4QFY16
y-o-y (%)
3QFY17
q-o-q (%)
Net sales
1,163
1,185
(1.8)
979
18.8
EBITDA
125
125
(0.2)
128
(2.4)
EBITDA margin (%)
10.7
10.6
13.1
Net profit
48
51
(7.7)
48
(2.0)
JSW Steel Ltd Consol - May 17, 2017
Particulars ( ` cr)
4QFY17E
4QFY16
y-o-y (%)
3QFY17
q-o-q (%)
Net sales
16,730
10,471
59.8
13,798
21.3
EBITDA
3,039
1,825
66.6
2,867
6.0
EBITDA margin (%)
18.2
17.4
20.8
Net profit
773
170
354.2
730
5.8
Bajaj Finance - May 17, 2017
Particulars ( ` cr)
4QFY17E
4QFY16
y-o-y (%)
3QFY17
q-o-q (%)
Net profit
449
315
42.5
556
(23.8)
Hindustan Unilever Ltd - May 17, 2017
Particulars ( ` cr)
4QFY17E
4QFY16
y-o-y (%)
3QFY17
q-o-q (%)
Net sales
8,038
7,809
2.9
7,513
7.0
EBITDA
1,563
1,467
6.6
1,355
15.3
EBITDA margin (%)
19.5
18.8
18.0
Net profit
1,097
1,090
0.7
1,038
5.7
Bank of Baroda - May 18, 2017
Particulars ( ` cr)
4QFY17E
4QFY16
y-o-y (%)
3QFY17
q-o-q (%)
Net profit
500
(3,230)
115.5
253
97.8
Bajaj Auto Ltd - May 18, 2017
Particulars ( ` cr)
4QFY17E
4QFY16
y-o-y (%)
3QFY17
q-o-q (%)
Net sales
4,797
5,304
(10)
4,976
(4)
EBITDA
958
1,152
(17)
1,044
(8)
EBITDA margin (%)
20
22
21
Net profit
842
803
5
925
(9)
Cummins India Ltd - May 18, 2017
Particulars ( ` cr)
4QFY17E
4QFY16
y-o-y (%)
3QFY17
q-o-q (%)
Net sales
1,268
1,038
22.2
1,324
(4.2)
EBITDA
209
171
22.1
226
(7.9)
EBITDA margin (%)
16.4
16.5
17.1
Net profit
197
164
19.7
198
(0.8)
Market Outlook
May 17, 2017
Top Picks ★★★★★
Market Cap
CMP
Target
Upside
Company
Rationale
(` Cr)
(`)
(`)
(%)
Strong growth in domestic business due to its leadership
in acute therapeutic segment. Alkem expects to launch
Alkem Laboratories
22,820
1,909
2,257
18.3
more products in USA, which bodes for its international
business.
We expect the company would report strong profitability
Asian Granito
1,155
384
405
5.5
owing to better product mix, higher B2C sales and
amalgamation synergy..
Favourable outlook for the AC industry to augur well for
Cooling products business which is out pacing the market
Blue Star
6,474
677
760
12.2
growth. EMPPAC division's profitability to improve once
operating environment turns around..
With a focus on the low and medium income (LMI)
consumer segment, the company has increased its
Dewan Housing Finance
13,292
424
520
22.5
presence in tier-II & III cities where the growth opportunity
is immense.
Strong loan growth backed by diversified loan portfolio
and adequate CAR. ROE & ROA likely to remain decent
Equitas Holdings
5,574
165
235
42.4
as risk of dilution remains low. Attractive valuations
considering growth.
Economic recovery to have favourable impact on
advertising & circulation revenue growth. Further, the
Jagran Prakashan
6,313
193
225
16.5
acquisition of a radio business (Radio City) would also
boost the company's revenue growth.
High order book execution in EPC segment, rising B2C
KEI Industries
1,712
220
239
8.4
sales and higher exports to boost the revenues and
profitability
Speedier execution and speedier sales, strong revenue
Mahindra Lifespace
2,319
452
522
15.5
visibilty in short-to-long run, attractive valuations
Massive capacity expansion along with rail advantage at
Navkar Corporation
3,356
235
265
12.6
ICD as well CFS augurs well for the company
Strong brands and distribution network would boost
Siyaram Silk Mills
1,622
1,730
1,872
8.2
growth going ahead. Stock currently trades at an
inexpensive valuation.
Market leadership in Hindi news genre and no.
2
viewership ranking in English news genre, exit from the
TV Today Network
1,604
269
344
28.0
radio business, and anticipated growth in ad spends by
corporates to benefit the stock.
Source: Company, Angel Research
Market Outlook
May 17, 2017
Key Upcoming Events
Result Calendar
Date
Company
May 17, 2017
J K Lakshmi Cements, Allahabad Bank, HUL, NIIT, JSW Steel , UFO Moviez
Bajaj Auto, Automotive Axle, Cummins India, Bank of Baroda, Hindustan Media Ventures, Jyothy Laboratories, CESC,
May 18, 2017
Coffee Day Enterprises Ltd
Motherson Sumi, KEC International, HT Media, Electrosteel Castings, Abbott India, MM Forging, Elecon
May 19, 2017
Engineering, GSK Pharma, Tata Power Co., VRL Logistics
Source: Bloomberg, Angel Research
Global economic events release calendar
Bloomberg Data
Date
Time
Country
Event Description
Unit
Period
Last Reported
Estimated
May 17, 2017
6:00 PMUS
Initial Jobless claims
Thousands
May 13
236.00
240.00
2:30 PMEuro Zone Euro-Zone CPI (YoY)
%
Apr F
1.90
1.90
May 18, 2017
2:00 PMUK
Jobless claims change
% Change
Apr
25.50
May 19, 2017
7:30 PMEuro Zone Euro-Zone Consumer Confidence
Value
May A
(3.60)
(3.00)
May 23, 2017
11:30 AMGermany GDP nsa (YoY)
% Change
1Q F
2.90
7:30 PMUS
New home sales
Thousands
Apr
621.00
625.00
May 24, 2017
1:00 PMGermany PMI Services
Value
May P
55.40
1:00 PMGermany PMI Manufacturing
Value
May P
58.20
7:30 PMUS
Existing home sales
Million
Apr
5.71
5.67
May 25, 2017
2:00 PMUK
GDP (YoY)
% Change
1Q P
2.10
May 26, 2017
6:00 PMUS
GDP Qoq (Annualised)
% Change
1Q S
0.70
0.90
May 30, 2017
7:30 PMUS
Consumer Confidence
S.A./ 1985=100 May
120.30
May 31, 2017
6:30 AMChina
PMI Manufacturing
Value
May
51.20
1:25 PMGermany Unemployment change (000's)
Thousands
May
(15.00)
Jun 01, 2017
2:00 PMUK
PMI Manufacturing
Value
May
57.30
Source: Bloomberg, Angel Research
Market Outlook
May 17, 2017
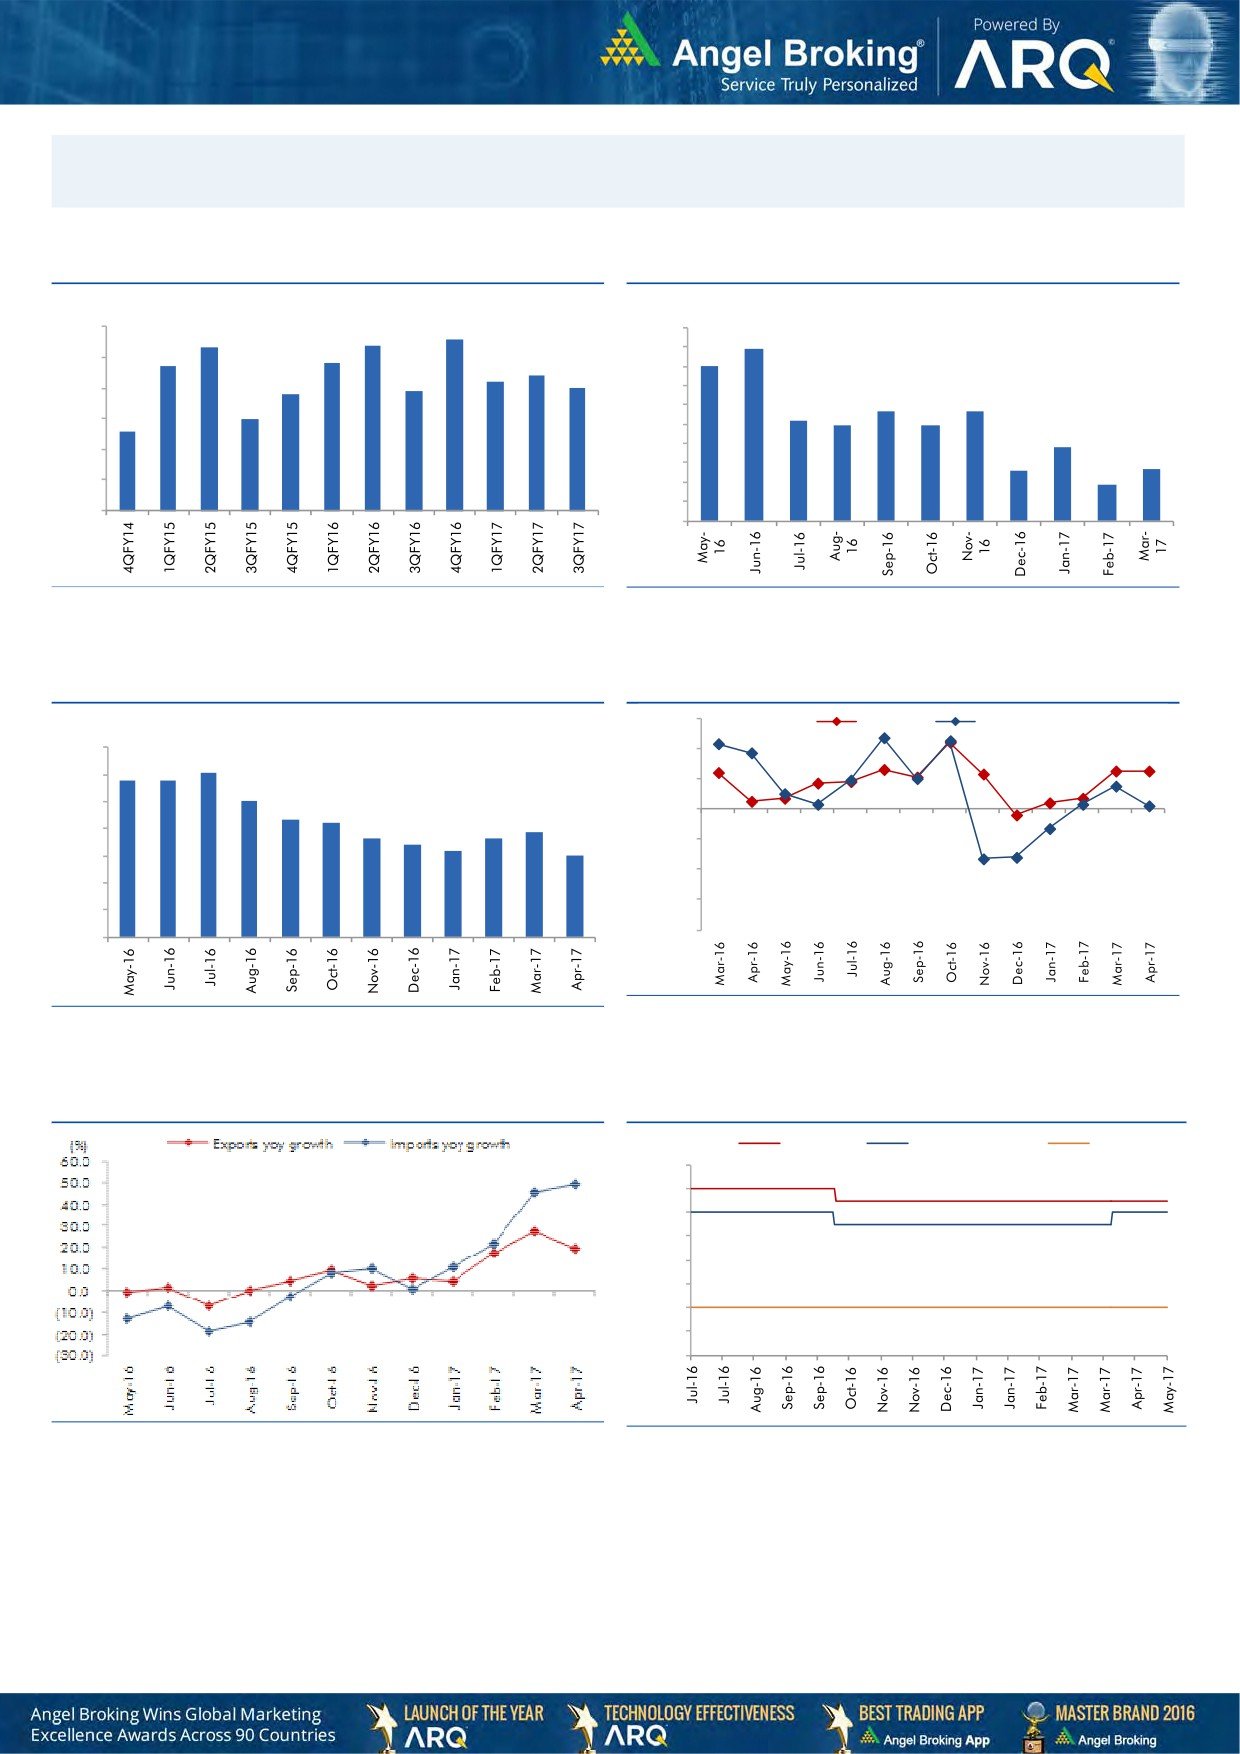
Macro watch
Exhibit 1: Quarterly GDP trends
Exhibit 2: IIP trends
(%)
(%)
8.6
9.0
8.3
8.4
10.0
8.9
7.7
7.8
9.0
8.0
8.0
7.4
7.2
8.0
6.9
7.0
6.8
7.0
7.0
5.7
5.7
6.0
6.0
5.2
4.9
4.9
6.0
5.6
5.0
3.8
4.0
5.0
2.6
2.7
3.0
1.9
4.0
2.0
1.0
3.0
-
Source: CSO, Angel Research
Source: MOSPI, Angel Research
Exhibit 3: Monthly CPI inflation trends
Exhibit 4: Manufacturing and services PMI
56.0
Mfg. PMI
Services PMI
(%)
7.0
54.0
6.1
5.8
5.8
6.0
52.0
5.1
5.0
4.3
4.2
50.0
3.9
3.6
3.7
4.0
3.4
3.2
3.0
48.0
3.0
46.0
2.0
44.0
1.0
42.0
-
Source: Market, Angel Research; Note: Level above 50 indicates expansion
Source: MOSPI, Angel Research
Exhibit 5: Exports and imports growth trends
Exhibit 6: Key policy rates
(%)
Repo rate
Reverse Repo rate
CRR
7.00
6.50
6.00
5.50
5.00
4.50
4.00
3.50
3.00
Source: Bloomberg, Angel Research
Source: RBI, Angel Research
Market Outlook
May 17, 2017
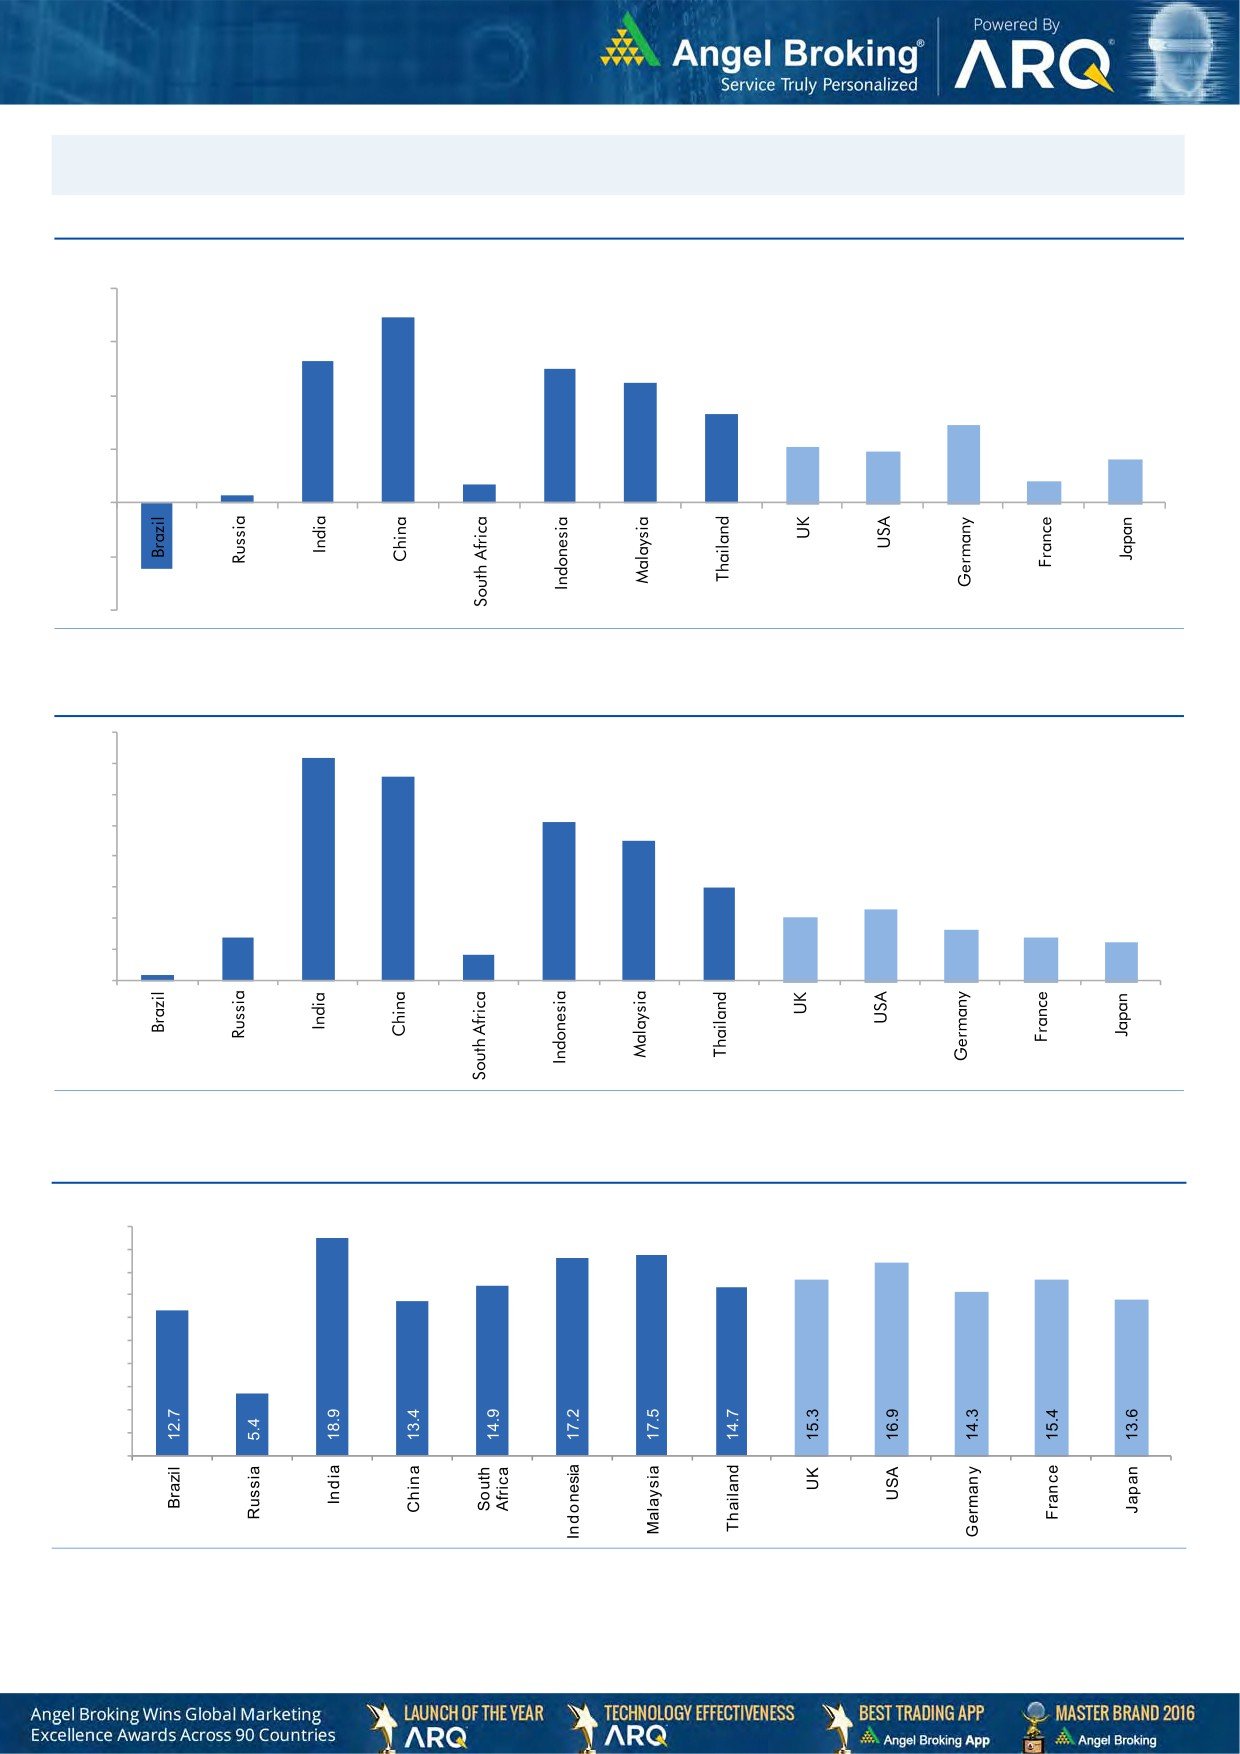
Global watch
Exhibit 1: Latest quarterly GDP Growth (%, yoy) across select developing and developed countries
(%)
8.0
6.9
6.0
5.3
5.0
0.7
4.5
4.0
3.3
2.9
2.1
1.9
2.0
0.3
1.6
0.8
-
(2.0)
(2.5)
(4.0)
Source: Bloomberg, Angel Research
Exhibit 2: 2016 GDP Growth projection by IMF (%, yoy) across select developing and developed countries
(%)
7.2
7.0
6.6
6.0
5.1
5.0
4.5
4.0
3.0
3.0
2.3
2.0
1.4
1.6
2.0
1.4
1.2
0.2
0.8
1.0
-
Source: IMF, Angel Research
Exhibit 3: One year forward P-E ratio across select developing and developed countries
(x)
20.0
18.0
16.0
14.0
12.0
10.0
8.0
6.0
4.0
2.0
-
Source: IMF, Angel Research
Market Outlook
May 17, 2017
Exhibit 4: Relative performance of indices across globe
Returns (%)
Country
Name of index
Closing price
1M
3M
1YR
Brazil
Bovespa
68,685
6.7
5.9
29.0
Russia
Micex
1,993
0.8
(9.0)
3.9
India
Nifty
9,512
3.4
8.5
21.2
China
Shanghai Composite
3,113
(4.2)
(3.3)
3.7
South Africa
Top 40
47,427
2.2
5.6
4.9
Mexico
Mexbol
49,460
(0.4)
4.7
7.8
Indonesia
LQ45
942
0.9
5.2
13.5
Malaysia
KLCI
1,778
2.0
4.0
8.9
Thailand
SET 50
985
(1.8)
(0.7)
11.6
USA
Dow Jones
20,980
2.6
2.8
19.7
UK
FTSE
7,522
2.1
3.6
22.0
Japan
Nikkei
19,920
6.3
5.4
22.8
Germany
DAX
12,805
5.5
9.8
30.1
France
CAC
5,406
6.0
12.0
22.0
Source: Bloomberg, Angel Research
Stock Watch
May 17, 2017
Company Name
Reco
CMP
Target
Mkt Cap
Sales ( Čcr )
OPM(%)
EPS (Č)
PER(x)
P/BV(x)
RoE(%)
EV/Sales(x)
(Č)
Price ( Č)
( Č cr )
FY17E FY18E
FY17E
FY18E
FY17E
FY18E
FY17E
FY18E
FY17E
FY18E
FY17E
FY18E
FY17E
FY18E
Agri / Agri Chemical
Rallis
Neutral
249
-
4,839
1,937
2,164
13.3
14.3
9.0
11.0
27.7
22.6
4.8
4.2
18.4
19.8
2.5
2.2
United Phosphorus
Neutral
826
-
41,969
15,176
17,604
18.5
18.5
37.4
44.6
22.1
18.5
4.3
3.6
21.4
21.2
2.9
2.4
Auto & Auto Ancillary
Ashok Leyland
Buy
87
111
24,645
20,021
21,915
11.6
11.9
4.5
5.3
19.2
16.3
3.9
3.5
20.6
21.5
1.2
1.0
Bajaj Auto
Neutral
3,024
-
87,502
25,093
27,891
19.5
19.2
143.9
162.5
21.0
18.6
5.9
5.1
30.3
29.4
3.2
2.8
Bharat Forge
Neutral
1,124
-
26,170
7,726
8,713
20.5
21.2
35.3
42.7
31.9
26.3
5.9
5.3
18.9
20.1
3.5
3.0
Eicher Motors
Neutral
29,363
-
79,896
16,583
20,447
17.5
18.0
598.0
745.2
49.1
39.4
16.8
12.8
41.2
38.3
4.6
3.7
Gabriel India
Neutral
130
-
1,863
1,544
1,715
9.0
9.3
5.4
6.3
24.0
20.6
4.5
4.0
18.9
19.5
1.2
1.0
Hero Motocorp
Neutral
3,619
-
72,270
28,083
30,096
15.3
15.7
171.8
187.0
21.1
19.4
7.4
6.2
30.1
27.9
2.4
2.2
Jamna Auto Industries Neutral
242
-
1,928
1,486
1,620
9.8
9.9
15.0
17.2
16.1
14.1
3.5
3.0
21.8
21.3
1.4
1.2
L G Balakrishnan & Bros Neutral
712
-
1,118
1,302
1,432
11.6
11.9
43.7
53.0
16.3
13.4
2.3
2.1
13.8
14.2
1.0
0.9
Mahindra and Mahindra Neutral
1,367
-
84,922
46,534
53,077
11.6
11.7
67.3
78.1
20.3
17.5
3.3
2.9
15.4
15.8
1.8
1.5
Maruti
Neutral
6,953
-
210,024
67,822
83,288
16.0
16.4
253.8
312.4
27.4
22.3
6.3
5.1
23.0
22.9
2.8
2.2
Minda Industries
Neutral
546
-
4,715
2,728
3,042
9.0
9.1
68.2
86.2
8.0
6.3
1.8
1.4
23.8
24.3
1.8
1.6
Motherson Sumi
Neutral
419
-
58,844
45,896
53,687
7.8
8.3
13.0
16.1
32.2
26.0
10.4
8.3
34.7
35.4
1.4
1.1
Rane Brake Lining
Neutral
1,014
-
803
511
562
11.3
11.5
28.1
30.9
36.1
32.8
5.5
5.0
15.3
15.0
1.7
1.6
Setco Automotive
Neutral
41
-
546
741
837
13.0
13.0
15.2
17.0
2.7
2.4
0.4
0.4
15.8
16.3
1.1
1.0
Tata Motors
Neutral
437
-
126,264
300,209
338,549
8.9
8.4
42.7
54.3
10.3
8.1
1.6
1.4
15.6
17.2
0.5
0.5
TVS Motor
Neutral
533
-
25,313
13,390
15,948
6.9
7.1
12.8
16.5
41.8
32.2
10.4
8.2
26.3
27.2
1.9
1.6
Amara Raja Batteries
Accumulate
925
1,009
15,805
5,305
6,100
16.0
16.3
28.4
34.0
32.6
27.2
6.3
5.3
19.3
19.3
3.0
2.6
Exide Industries
Neutral
245
-
20,808
7,439
8,307
15.0
15.0
8.1
9.3
30.2
26.3
4.2
3.8
14.3
16.7
2.4
2.2
Apollo Tyres
Neutral
235
-
11,937
12,877
14,504
14.3
13.9
21.4
23.0
10.9
10.2
1.7
1.5
16.4
15.2
1.1
1.0
Ceat
Neutral
1,699
-
6,873
7,524
8,624
13.0
12.7
131.1
144.3
13.0
11.8
2.4
2.0
19.8
18.6
1.0
0.9
JK Tyres
Neutral
175
-
3,970
7,455
8,056
15.0
15.0
21.8
24.5
8.0
7.1
1.7
1.4
22.8
21.3
0.7
0.6
Swaraj Engines
Neutral
1,850
-
2,298
660
810
15.2
16.4
54.5
72.8
34.0
25.4
10.6
9.6
31.5
39.2
3.3
2.7
Subros
Neutral
248
-
1,488
1,488
1,681
11.7
11.9
6.4
7.2
38.8
34.6
4.1
3.7
10.8
11.4
1.2
1.1
Indag Rubber
Neutral
211
-
555
286
326
19.8
16.8
11.7
13.3
18.1
15.9
3.1
2.9
17.8
17.1
1.6
1.4
Capital Goods
ACE
Neutral
67
-
666
709
814
4.1
4.6
1.4
2.1
48.1
32.1
2.0
1.9
4.4
6.0
1.1
1.0
BEML
Neutral
1,375
-
5,726
3,451
4,055
6.3
9.2
31.4
57.9
43.8
23.8
2.6
2.4
6.3
10.9
1.8
1.5
Bharat Electronics
Neutral
182
-
40,741
8,137
9,169
16.8
17.2
58.7
62.5
3.1
2.9
0.5
0.4
44.6
46.3
4.0
3.6
Stock Watch
May 17, 2017
Company Name
Reco
CMP
Target
Mkt Cap
Sales ( Čcr )
OPM(%)
EPS (Č)
PER(x)
P/BV(x)
RoE(%)
EV/Sales(x)
(Č)
Price ( Č)
( Č cr )
FY17E
FY18E
FY17E
FY18E
FY17E
FY18E
FY17E
FY18E
FY17E
FY18E
FY17E
FY18E
FY17E
FY18E
Capital Goods
Voltas
Neutral
434
-
14,344
6,511
7,514
7.9
8.7
12.9
16.3
33.6
26.6
6.1
5.3
16.7
18.5
2.0
1.7
BGR Energy
Neutral
174
-
1,259
16,567
33,848
6.0
5.6
7.8
5.9
22.4
29.6
1.3
1.2
4.7
4.2
0.2
0.1
BHEL
Neutral
171
-
41,744
28,797
34,742
-
2.8
2.3
6.9
74.2
24.7
1.3
1.2
1.3
4.8
1.1
0.8
Blue Star
Accumulate
677
760
6,474
4,283
5,077
5.9
7.3
14.9
22.1
45.5
30.6
8.8
7.4
20.4
26.4
1.6
1.3
CG Power and Industrial
Neutral
94
-
5,920
5,777
6,120
5.9
7.0
3.3
4.5
28.6
21.0
1.3
1.2
4.4
5.9
1.0
0.8
Solutions
Greaves Cotton
Neutral
158
-
3,861
1,755
1,881
16.8
16.9
7.8
8.5
20.3
18.6
4.1
3.8
20.6
20.9
1.9
1.7
Inox Wind
Neutral
163
-
3,610
5,605
6,267
15.7
16.4
24.8
30.0
6.6
5.4
1.8
1.3
25.9
24.4
0.7
0.6
KEC International
Neutral
248
-
6,375
9,294
10,186
7.9
8.1
9.9
11.9
25.1
20.8
3.7
3.2
15.6
16.3
0.9
0.8
KEI Industries
Accumulate
220
239
1,712
2,682
3,058
10.4
10.0
11.7
12.8
18.8
17.2
3.8
3.1
20.1
18.2
0.8
0.7
Thermax
Neutral
1,008
-
12,006
5,421
5,940
7.3
7.3
25.7
30.2
39.2
33.4
4.7
4.3
12.2
13.1
2.1
1.9
VATech Wabag
Neutral
668
-
3,647
3,136
3,845
8.9
9.1
26.0
35.9
25.7
18.6
3.2
2.7
13.4
15.9
1.1
0.8
Cement
ACC
Neutral
1,729
-
32,477
11,225
13,172
13.2
16.9
44.5
75.5
38.9
22.9
3.7
3.4
11.2
14.2
2.9
2.5
Ambuja Cements
Neutral
261
-
51,746
9,350
10,979
18.2
22.5
5.8
9.5
44.9
27.4
3.8
3.4
10.2
12.5
5.5
4.7
India Cements
Neutral
221
-
6,784
4,364
4,997
18.5
19.2
7.9
11.3
28.0
19.5
2.0
2.0
8.0
8.5
2.3
2.0
JK Cement
Neutral
1,118
-
7,814
4,398
5,173
15.5
17.5
31.2
55.5
35.8
20.1
4.3
3.7
12.0
15.5
2.3
1.9
J K Lakshmi Cement
Neutral
527
-
6,204
2,913
3,412
14.5
19.5
7.5
22.5
70.3
23.4
4.3
3.6
12.5
18.0
2.7
2.3
Orient Cement
Neutral
163
-
3,338
2,114
2,558
18.5
20.5
8.1
11.3
20.1
14.4
3.0
2.5
9.0
14.0
2.2
1.7
UltraTech Cement
Neutral
4,487
-
123,158
25,768
30,385
21.0
23.5
111.0
160.0
40.4
28.0
5.2
4.5
13.5
15.8
4.9
4.1
Construction
ITNL
Neutral
114
-
3,757
8,946
10,017
31.0
31.6
8.1
9.1
14.1
12.6
0.5
0.5
4.2
5.0
3.8
3.5
KNR Constructions
Neutral
214
-
3,011
1,385
1,673
14.7
14.0
41.2
48.5
5.2
4.4
1.0
0.8
14.9
15.2
2.3
1.9
Larsen & Toubro
Neutral
1,745
-
162,875
111,017
124,908
11.0
11.0
61.1
66.7
28.6
26.2
3.4
3.2
13.1
12.9
2.5
2.3
Gujarat Pipavav Port
Neutral
163
-
7,882
705
788
52.2
51.7
5.0
5.6
32.6
29.1
3.2
2.9
11.2
11.2
10.8
9.2
Nagarjuna Const.
Neutral
100
-
5,570
8,842
9,775
9.1
8.8
5.3
6.4
18.9
15.7
1.5
1.4
8.2
9.1
0.8
0.7
PNC Infratech
Neutral
158
-
4,043
2,350
2,904
13.1
13.2
9.0
8.8
17.5
17.9
0.6
0.6
15.9
13.9
1.8
1.5
Simplex Infra
Neutral
411
-
2,032
6,829
7,954
10.5
10.5
31.4
37.4
13.1
11.0
1.4
1.2
9.9
13.4
0.7
0.6
Power Mech Projects
Neutral
585
-
861
1,801
2,219
12.7
14.6
72.1
113.9
8.1
5.1
1.5
1.3
16.8
11.9
0.5
0.4
Sadbhav Engineering
Neutral
340
-
5,834
3,598
4,140
10.3
10.6
9.0
11.9
37.8
28.6
4.0
3.5
9.9
11.9
1.9
1.6
NBCC
Neutral
198
-
17,843
7,428
9,549
7.9
8.6
8.2
11.0
24.2
18.0
1.2
1.0
28.2
28.7
2.1
1.6
MEP Infra
Neutral
73
-
1,181
1,877
1,943
30.6
29.8
3.0
4.2
24.2
17.3
11.7
7.9
0.6
0.6
2.0
1.8
Stock Watch
May 17, 2017
Company Name
Reco
CMP
Target
Mkt Cap
Sales ( Čcr )
OPM(%)
EPS (Č)
PER(x)
P/BV(x)
RoE(%)
EV/Sales(x)
(Č)
Price ( Č)
( Č cr )
FY17E
FY18E
FY17E
FY18E
FY17E
FY18E
FY17E
FY18E
FY17E
FY18E
FY17E
FY18E
FY17E
FY18E
Construction
SIPL
Neutral
111
-
3,917
1,036
1,252
65.5
66.2
(8.4)
(5.6)
4.2
4.8
(22.8)
(15.9)
12.0
10.0
Engineers India
Neutral
174
-
11,692
1,725
1,935
16.0
19.1
11.4
13.9
15.2
12.5
2.1
2.0
13.4
15.3
5.7
5.1
Financials
Axis Bank
Buy
502
580
120,207
46,932
53,575
3.5
3.4
32.4
44.6
15.5
11.2
2.0
1.7
13.6
16.5
-
-
Bank of Baroda
Neutral
194
-
44,597
19,980
23,178
1.8
1.8
11.5
17.3
16.8
11.2
1.9
1.6
8.3
10.1
-
-
Canara Bank
Neutral
373
-
22,294
15,225
16,836
1.8
1.8
14.5
28.0
25.7
13.3
1.8
1.4
5.8
8.5
-
-
Can Fin Homes
Neutral
2,765
-
7,362
420
526
3.5
3.5
86.5
107.8
32.0
25.7
6.9
5.6
23.6
24.1
-
-
Cholamandalam Inv. &
Buy
1,025
1,230
16,017
2,012
2,317
6.3
6.3
42.7
53.6
24.0
19.1
3.8
3.3
16.9
18.3
-
-
Fin. Co.
Dewan Housing Finance Buy
424
520
13,292
2,225
2,688
2.9
2.9
29.7
34.6
14.3
12.3
2.3
1.5
16.1
14.8
-
-
Equitas Holdings
Buy
165
235
5,574
939
1,281
11.7
11.5
5.8
8.2
28.5
20.1
2.5
2.2
10.9
11.5
-
-
Federal Bank
Accumulate
115
125
19,872
8,259
8,995
3.0
3.0
4.3
5.6
26.8
20.6
2.3
2.1
8.5
10.1
-
-
HDFC
Neutral
1,567
-
248,888
11,475
13,450
3.4
3.4
45.3
52.5
34.6
29.8
6.7
5.9
20.2
20.5
-
-
HDFC Bank
Accumulate
1,559
1,650
399,908
46,097
55,433
4.5
4.5
58.4
68.0
26.7
22.9
4.7
3.9
18.8
18.6
-
-
ICICI Bank
Neutral
303
-
176,341
42,800
44,686
3.1
3.3
18.0
21.9
16.8
13.8
2.3
2.1
11.1
12.3
-
-
Karur Vysya Bank
Buy
117
140
7,098
5,640
6,030
3.3
3.2
8.9
10.0
13.2
11.8
1.4
1.3
11.2
11.4
-
-
Lakshmi Vilas Bank
Neutral
191
-
3,660
3,339
3,799
2.7
2.8
11.0
14.0
17.4
13.7
1.8
1.7
11.2
12.7
-
-
LIC Housing Finance
Neutral
695
-
35,089
3,712
4,293
2.6
2.5
39.0
46.0
17.8
15.1
3.3
2.9
19.9
20.1
-
-
Punjab Natl.Bank
Neutral
175
-
37,144
23,532
23,595
2.3
2.4
6.8
12.6
25.7
13.9
4.0
2.8
3.3
6.5
-
-
RBL Bank
Neutral
563
-
21,109
1,783
2,309
2.6
2.6
12.7
16.4
44.3
34.3
4.8
4.3
12.8
13.3
-
-
Repco Home Finance
Accumulate
766
825
4,791
388
457
4.5
4.2
30.0
38.0
25.5
20.2
4.3
3.6
18.0
19.2
-
-
South Ind.Bank
Neutral
25
-
4,552
6,435
7,578
2.5
2.5
2.7
3.1
9.4
8.2
1.2
1.0
10.1
11.2
-
-
St Bk of India
Neutral
307
-
248,973
88,650
98,335
2.6
2.6
13.5
18.8
22.7
16.3
2.2
1.9
7.0
8.5
-
-
Union Bank
Neutral
180
-
12,405
13,450
14,925
2.3
2.3
25.5
34.5
7.1
5.2
1.0
0.9
7.5
10.2
-
-
Yes Bank
Neutral
1,483
-
67,744
8,978
11,281
3.3
3.4
74.0
90.0
20.1
16.5
3.8
3.2
17.0
17.2
-
-
FMCG
Akzo Nobel India
Neutral
1,950
-
9,352
2,955
3,309
13.3
13.7
57.2
69.3
34.1
28.1
11.1
9.4
32.7
33.3
3.0
2.6
Asian Paints
Neutral
1,144
-
109,708
17,128
18,978
16.8
16.4
19.1
20.7
59.9
55.3
20.8
19.7
34.8
35.5
6.3
5.7
Britannia
Neutral
3,755
-
45,060
9,594
11,011
14.6
14.9
80.3
94.0
46.8
40.0
19.2
14.9
41.2
-
4.6
3.9
Colgate
Neutral
976
-
26,544
4,605
5,149
23.4
23.4
23.8
26.9
41.0
36.3
22.7
17.7
64.8
66.8
5.7
5.1
Dabur India
Accumulate
274
304
48,248
8,315
9,405
19.8
20.7
8.1
9.2
33.8
29.8
9.4
7.8
31.6
31.0
5.5
4.8
GlaxoSmith Con*
Neutral
5,294
-
22,264
4,350
4,823
21.2
21.4
179.2
196.5
29.5
27.0
7.8
6.6
27.1
26.8
4.5
4.0
Stock Watch
May 17, 2017
Company Name
Reco
CMP
Target
Mkt Cap
Sales ( Čcr )
OPM(%)
EPS (Č)
PER(x)
P/BV(x)
RoE(%)
EV/Sales(x)
(Č)
Price ( Č)
( Č cr )
FY17E FY18E
FY17E
FY18E
FY17E
FY18E
FY17E
FY18E
FY17E
FY18E
FY17E
FY18E
FY17E
FY18E
FMCG
Godrej Consumer
Neutral
1,876
-
63,898
10,235
11,428
18.4
18.6
41.1
44.2
45.7
42.4
10.1
8.5
24.9
24.8
6.3
5.6
HUL
Neutral
998
-
216,035
35,252
38,495
17.8
17.8
20.7
22.4
48.3
44.6
46.2
39.6
95.6
88.9
6.0
5.5
ITC
Neutral
283
-
344,317
40,059
44,439
38.3
39.2
9.0
10.1
31.6
28.0
8.8
7.7
27.8
27.5
8.1
7.3
Marico
Neutral
310
-
40,005
6,430
7,349
18.8
19.5
6.4
7.7
48.4
40.3
14.6
12.3
33.2
32.5
6.0
5.2
Nestle*
Neutral
6,476
-
62,441
10,073
11,807
20.7
21.5
124.8
154.2
51.9
42.0
21.3
19.2
34.8
36.7
6.0
5.1
Tata Global
Neutral
154
-
9,738
8,675
9,088
9.8
9.8
7.4
8.2
20.9
18.8
1.7
1.6
7.9
8.1
1.0
1.0
Procter & Gamble
Neutral
8,048
-
26,123
2,939
3,342
23.2
23.0
146.2
163.7
55.1
49.2
13.9
11.6
25.3
23.5
8.4
7.3
Hygiene
IT
HCL Tech^
Buy
849
1,014
121,229
46,723
52,342
22.1
20.9
60.0
62.8
14.2
13.5
3.6
3.0
25.3
22.4
2.3
2.0
Infosys
Buy
957
1,179
219,703
68,484
73,963
26.0
26.0
63.0
64.0
15.2
15.0
3.2
2.9
20.8
19.7
2.9
2.5
TCS
Accumulate
2,427
2,651
478,272
117,966
127,403
27.5
27.6
134.3
144.5
18.1
16.8
5.4
5.0
29.8
29.7
3.7
3.5
Tech Mahindra
Buy
444
600
43,219
29,673
32,937
15.5
17.0
32.8
39.9
13.5
11.1
2.7
2.3
19.6
20.7
1.2
1.0
Wipro
Accumulate
515
570
125,212
55,421
58,536
20.3
20.3
35.1
36.5
14.7
14.1
2.5
2.2
19.2
14.6
1.7
1.4
Media
D B Corp
Neutral
360
-
6,623
2,297
2,590
27.4
28.2
21.0
23.4
17.2
15.4
4.0
3.5
23.7
23.1
2.7
2.3
HT Media
Neutral
86
-
2,002
2,693
2,991
12.6
12.9
7.9
9.0
10.9
9.6
0.9
0.9
7.8
8.3
0.3
0.2
Jagran Prakashan
Buy
193
225
6,313
2,355
2,635
28.0
28.0
10.8
12.5
17.9
15.5
3.9
3.4
21.7
21.7
2.7
2.4
Sun TV Network
Neutral
895
-
35,275
2,850
3,265
70.1
71.0
26.2
30.4
34.2
29.4
8.7
7.7
24.3
25.6
12.0
10.3
Hindustan Media
Neutral
284
-
2,087
1,016
1,138
24.3
25.2
27.3
30.1
10.4
9.5
2.0
1.8
16.2
15.8
1.4
1.2
Ventures
TV Today Network
Buy
269
344
1,604
567
645
26.7
27.0
15.4
18.1
17.5
14.9
2.6
2.3
14.9
15.2
2.4
2.0
Metals & Mining
Coal India
Neutral
275
-
170,828
84,638
94,297
21.4
22.3
24.5
27.1
11.2
10.2
4.7
4.5
42.6
46.0
1.5
1.4
Hind. Zinc
Neutral
252
-
106,394
14,252
18,465
55.9
48.3
15.8
21.5
15.9
11.7
2.6
2.3
17.0
20.7
7.5
5.8
Hindalco
Neutral
196
-
44,070
107,899
112,095
7.4
8.2
9.2
13.0
21.4
15.1
1.0
1.0
4.8
6.6
0.9
0.9
JSW Steel
Neutral
202
-
48,743
53,201
58,779
16.1
16.2
130.6
153.7
1.5
1.3
0.2
0.2
14.0
14.4
1.7
1.5
NMDC
Neutral
128
-
40,466
6,643
7,284
44.4
47.7
7.1
7.7
18.0
16.6
1.6
1.5
8.8
9.2
3.9
3.5
SAIL
Neutral
62
-
25,441
47,528
53,738
(0.7)
2.1
(1.9)
2.6
23.7
0.7
0.6
(1.6)
3.9
1.4
1.3
Vedanta
Neutral
238
-
88,506
71,744
81,944
19.2
21.7
13.4
20.1
17.8
11.9
1.5
1.4
8.4
11.3
1.6
1.3
Tata Steel
Neutral
457
-
44,385
121,374
121,856
7.2
8.4
18.6
34.3
24.6
13.3
1.5
1.4
6.1
10.1
1.0
1.0
Oil & Gas
GAIL
Neutral
411
-
69,479
56,220
65,198
9.3
10.1
27.1
33.3
15.2
12.3
1.4
1.3
9.3
10.7
1.4
1.2
ONGC
Neutral
185
-
237,543
137,222
152,563
15.0
21.8
19.5
24.1
9.5
7.7
0.8
0.8
8.5
10.1
2.0
1.8
Indian Oil Corp
Neutral
447
-
216,865
373,359
428,656
5.9
5.5
54.0
59.3
8.3
7.5
1.3
1.2
16.0
15.6
0.7
0.6
Stock Watch
May 17, 2017
Company Name
Reco
CMP
Target
Mkt Cap
Sales ( Čcr )
OPM(%)
EPS (Č)
PER(x)
P/BV(x)
RoE(%)
EV/Sales(x)
(Č)
Price ( Č)
( Č cr )
FY17E FY18E
FY17E
FY18E
FY17E
FY18E
FY17E
FY18E
FY17E
FY18E
FY17E
FY18E
FY17E
FY18E
Oil & Gas
Reliance Industries
Neutral
1,356
-
441,011
301,963
358,039
12.1
12.6
87.7
101.7
15.5
13.3
1.6
1.4
10.7
11.3
1.9
1.6
Pharmaceuticals
Alembic Pharma
Accumulate
607
648
11,443
3,101
3,966
19.7
20.5
21.4
25.5
28.4
23.8
6.0
4.9
23.0
22.8
3.7
2.7
Alkem Laboratories Ltd
Buy
1,909
2,257
22,820
6,065
7,009
18.7
20.0
80.2
92.0
23.8
20.8
5.3
4.5
22.5
21.6
3.7
3.2
Aurobindo Pharma
Buy
615
877
36,002
15,720
18,078
23.7
23.7
41.4
47.3
14.8
13.0
3.9
3.0
29.6
26.1
2.5
2.2
Aventis*
Neutral
4,223
-
9,727
2,206
2,508
16.6
16.8
128.9
139.9
32.8
30.2
5.6
4.4
21.6
23.5
4.2
3.5
Cadila Healthcare
Neutral
489
-
50,046
10,429
12,318
17.7
21.6
13.1
19.2
37.3
25.5
7.8
6.2
22.8
27.1
4.8
4.0
Cipla
Sell
564
465
45,409
15,378
18,089
15.7
16.8
19.3
24.5
29.2
23.0
3.4
3.0
12.3
13.9
3.1
2.6
Dr Reddy's
Neutral
2,723
-
45,115
16,043
18,119
18.0
23.0
78.6
130.9
34.7
20.8
3.4
3.0
10.1
15.2
2.6
2.5
Dishman Pharma
Sell
310
143
5,010
1,718
1,890
22.7
22.8
9.5
11.3
32.7
27.5
3.2
2.9
10.1
10.9
3.4
3.0
GSK Pharma*
Neutral
2,428
-
20,563
2,800
3,290
10.2
20.6
32.2
60.3
75.4
40.3
14.0
13.8
17.2
34.5
7.1
6.1
Indoco Remedies
Accumulate
221
240
2,033
1,112
1,289
16.2
18.2
11.6
16.0
19.0
13.8
3.0
2.6
17.0
20.1
2.0
1.6
Ipca labs
Accumulate
551
613
6,953
3,258
3,747
12.8
15.3
12.1
19.2
45.6
28.7
2.9
2.6
6.4
9.5
2.3
2.0
Lupin
Buy
1,291
1,809
58,284
15,912
18,644
26.4
26.7
58.1
69.3
22.2
18.6
4.3
3.5
21.4
20.9
3.7
3.1
Natco Pharma
Neutral
950
-
16,554
2,090
2,335
32.1
26.6
26.8
23.2
35.4
41.0
10.0
8.7
28.4
21.1
8.0
98.1
Sun Pharma
Buy
652
847
156,442
31,129
35,258
32.0
32.9
30.2
35.3
21.6
18.5
3.5
2.9
20.0
20.1
4.6
3.9
Power
Tata Power
Neutral
84
-
22,680
36,916
39,557
17.4
27.1
5.1
6.3
16.4
13.3
1.5
1.3
9.0
10.3
1.6
1.5
NTPC
Neutral
160
-
131,721
86,605
95,545
17.5
20.8
11.8
13.4
13.5
11.9
1.4
1.3
10.5
11.1
2.9
2.9
Power Grid
Accumulate
208
223
108,555
25,315
29,193
88.2
88.7
14.2
17.2
14.7
12.1
2.2
1.9
15.2
16.1
8.9
8.0
Real Estate
Prestige Estate
Neutral
238
-
8,940
4,707
5,105
25.2
26.0
10.3
13.0
23.2
18.3
1.9
1.7
10.3
10.2
3.1
2.7
MLIFE
Buy
452
522
2,319
1,152
1,300
22.7
24.6
29.9
35.8
15.1
12.6
1.1
1.1
7.6
8.6
2.7
2.3
Telecom
Bharti Airtel
Neutral
375
-
149,783
105,086
114,808
34.5
34.7
12.2
16.4
30.7
22.9
2.1
1.9
6.8
8.4
2.3
2.0
Idea Cellular
Neutral
88
-
31,659
40,133
43,731
37.2
37.1
6.4
6.5
13.7
13.5
1.1
1.1
8.2
7.6
1.8
1.5
zOthers
Abbott India
Neutral
4,218
-
8,963
3,153
3,583
14.1
14.4
152.2
182.7
27.7
23.1
136.1
116.2
25.6
26.1
2.6
2.2
Asian Granito
Accumulate
384
405
1,155
1,060
1,169
12.2
12.5
12.7
15.9
30.3
24.2
2.9
2.6
9.5
10.7
1.4
1.2
Bajaj Electricals
Accumulate
346
395
3,507
4,801
5,351
5.7
6.2
10.4
13.7
33.2
25.3
4.1
3.7
12.4
14.5
0.7
0.7
Banco Products (India)
Neutral
239
-
1,710
1,353
1,471
12.3
12.4
14.5
16.3
16.5
14.7
22.8
20.5
14.5
14.6
1.2
129.6
Coffee Day Enterprises
Neutral
273
-
5,630
2,964
3,260
20.5
21.2
4.7
8.0
-
34.2
3.2
2.9
5.5
8.5
2.3
2.1
Ltd
Competent Automobiles Neutral
232
-
149
1,137
1,256
3.1
2.7
28.0
23.6
8.3
9.8
44.6
40.3
14.3
11.5
0.1
0.1
Elecon Engineering
Neutral
60
-
678
1,482
1,660
13.7
14.5
3.9
5.8
15.5
10.4
3.6
3.3
7.8
10.9
0.8
0.7
Stock Watch
May 17, 2017
Company Name
Reco
CMP
Target
Mkt Cap
Sales ( Čcr )
OPM(%)
EPS (Č)
PER(x)
P/BV(x)
RoE(%)
EV/Sales(x)
(Č)
Price ( Č)
( Č cr )
FY17E
FY18E
FY17E
FY18E
FY17E
FY18E
FY17E
FY18E
FY17E
FY18E
FY17E
FY18E
FY17E
FY18E
zOthers
Finolex Cables
Neutral
535
-
8,186
2,883
3,115
12.0
12.1
14.2
18.6
37.7
28.8
20.1
17.5
15.8
14.6
2.5
2.3
Garware Wall Ropes
Neutral
802
-
1,755
863
928
15.1
15.2
36.4
39.4
22.0
20.4
4.0
3.4
17.5
15.9
1.9
1.8
Goodyear India*
Neutral
846
-
1,951
1,598
1,704
10.4
10.2
49.4
52.6
17.1
16.1
79.1
69.4
18.2
17.0
0.9
128.7
Hitachi
Neutral
1,894
-
5,151
2,081
2,433
8.8
8.9
33.4
39.9
56.7
47.5
45.8
38.1
22.1
21.4
2.5
2.1
HSIL
Neutral
345
-
2,492
2,384
2,515
15.8
16.3
15.3
19.4
22.5
17.8
22.4
19.3
7.8
9.3
1.2
1.1
Interglobe Aviation
Neutral
1,116
-
40,329
21,122
26,005
14.5
27.6
110.7
132.1
10.1
8.5
60.3
43.1
168.5
201.1
1.9
1.5
Jyothy Laboratories
Neutral
378
-
6,860
1,440
2,052
11.5
13.0
8.5
10.0
44.4
37.8
10.8
10.0
18.6
19.3
5.0
3.5
Kirloskar Engines India
Neutral
400
-
5,785
2,554
2,800
9.9
10.0
10.5
12.1
38.1
33.1
15.9
15.0
10.7
11.7
1.9
1.7
Ltd
Linc Pen & Plastics
Neutral
284
-
420
382
420
9.3
9.5
13.5
15.7
21.1
18.1
3.6
3.1
17.1
17.3
1.2
1.0
M M Forgings
Neutral
639
-
771
546
608
20.4
20.7
41.3
48.7
15.5
13.1
87.5
77.5
16.6
17.0
1.3
1.1
Manpasand Bever.
Neutral
775
-
4,434
836
1,087
19.6
19.4
16.9
23.8
45.9
32.5
5.5
4.8
12.0
14.8
5.0
3.8
Mirza International
Neutral
135
-
1,627
963
1,069
17.2
18.0
6.1
7.5
22.1
18.0
3.4
2.9
15.0
15.7
1.9
1.7
MT Educare
Neutral
76
-
302
366
417
17.7
18.2
9.4
10.8
8.1
7.0
1.8
1.6
22.2
22.3
0.7
0.6
Narayana Hrudaya
Neutral
302
-
6,168
1,873
2,166
11.5
11.7
2.6
4.0
114.1
76.1
7.0
6.3
6.1
8.3
3.4
2.9
Navkar Corporation
Accumulate
235
265
3,356
369
561
42.9
42.3
6.9
11.5
34.1
20.4
2.4
2.1
7.4
10.5
10.1
6.6
Navneet Education
Neutral
166
-
3,886
1,062
1,147
24.0
24.0
6.1
6.6
27.3
25.1
5.6
5.0
20.6
19.8
3.7
3.5
Nilkamal
Neutral
2,072
-
3,092
1,995
2,165
10.7
10.4
69.8
80.6
29.7
25.7
118.4
102.9
16.6
16.5
1.5
1.4
Page Industries
Neutral
15,133
-
16,879
2,450
3,124
20.1
17.6
299.0
310.0
50.6
48.8
337.0
257.3
47.1
87.5
6.9
5.5
Parag Milk Foods
Neutral
250
-
2,101
1,919
2,231
9.3
9.6
9.5
12.9
26.4
19.3
4.1
3.4
15.5
17.5
1.2
1.1
Quick Heal
Neutral
235
-
1,644
408
495
27.3
27.0
7.7
8.8
30.3
26.7
2.8
2.8
9.3
10.6
3.2
2.6
Radico Khaitan
Accumulate
130
147
1,732
1,667
1,824
13.0
13.2
6.7
8.2
19.6
15.9
1.8
1.6
9.0
10.2
1.4
1.3
Relaxo Footwears
Neutral
467
-
5,610
2,085
2,469
9.2
8.2
7.6
8.0
61.8
58.8
24.0
20.4
17.9
18.8
2.8
2.4
S H Kelkar & Co.
Neutral
294
-
4,250
1,036
1,160
15.1
15.0
6.1
7.2
48.1
40.9
5.1
4.7
10.7
11.5
4.0
3.5
Siyaram Silk Mills
Accumulate
1,730
1,872
1,622
1,652
1,857
11.6
11.7
92.4
110.1
18.7
15.7
2.8
2.4
14.7
15.2
1.2
1.1
Styrolution ABS India*
Neutral
733
-
1,289
1,440
1,537
9.2
9.0
40.6
42.6
18.1
17.2
46.1
41.9
12.3
11.6
0.9
0.8
Surya Roshni
Neutral
285
-
1,251
3,342
3,625
7.8
7.5
17.3
19.8
16.5
14.4
31.4
25.2
10.5
10.8
0.6
0.6
Team Lease Serv.
Neutral
1,160
-
1,983
3,229
4,001
1.5
1.8
22.8
32.8
51.0
35.3
5.5
4.7
10.7
13.4
0.5
0.4
The Byke Hospitality
Neutral
202
-
812
287
384
20.5
20.5
7.6
10.7
26.6
18.9
5.6
4.5
20.7
23.5
2.8
2.1
Transport Corporation of
Neutral
258
-
1,974
2,671
2,911
8.5
8.8
13.9
15.7
18.6
16.5
2.5
2.3
13.7
13.8
0.8
0.8
India
Stock Watch
May 17, 2017
Company Name
Reco
CMP
Target Mkt Cap
Sales ( Čcr )
OPM(%)
EPS (Č)
PER(x)
P/BV(x)
RoE(%)
EV/Sales(x)
(Č)
Price ( Č)
( Č cr )
FY17E FY18E FY17E FY18E FY17E FY18E FY17E FY18E FY17E FY18E FY17E FY18E FY17E FY18E
zOthers
TVS Srichakra
Neutral
4,000
-
3,063
2,304
2,614
13.7
13.8
231.1
266.6
17.3
15.0
449.4
353.9
33.9
29.3
1.3
1.2
UFO Moviez
Neutral
437
-
1,207
619
685
33.2
33.4
30.0
34.9
14.6
12.5
2.0
1.7
13.8
13.9
1.7
1.3
Visaka Industries
Neutral
354
-
562
1,051
1,138
10.3
10.4
21.0
23.1
16.8
15.3
45.4
42.5
9.0
9.2
0.8
0.8
VRL Logistics
Neutral
332
-
3,026
1,902
2,119
16.7
16.6
14.6
16.8
22.8
19.7
5.0
4.4
21.9
22.2
1.7
1.5
VIP Industries
Accumulate
201
218
2,839
1,270
1,450
10.4
10.4
5.6
6.5
35.9
30.9
7.4
6.5
20.7
21.1
2.2
1.9
Navin Fluorine
Buy
3,003
3,650
2,940
789
945
21.1
22.4
120.1
143.4
25.0
20.9
4.0
3.5
17.8
18.5
3.7
3.0
Source: Company, Angel Research; Note: *December year end; #September year end; &October year end; Price as on May 16, 2017
Market Outlook
May 17, 2017
Research Team Tel: 022 - 39357800
DISCLAIMER
Angel Broking Private Limited (hereinafter referred to as “Angel”) is a registered Member of National Stock Exchange of India
Limited,Bombay Stock Exchange Limited and Metropolitan Stock Exchange Limited. It is also registered as a Depository Participant with
CDSL and Portfolio Manager with SEBI. It also has registration with AMFI as a Mutual Fund Distributor. Angel Broking Private Limited is a
registered entity with SEBI for Research Analyst in terms of SEBI (Research Analyst) Regulations, 2014 vide registration number
INH000000164. Angel or its associates has not been debarred/ suspended by SEBI or any other regulatory authority for accessing
/dealing in securities Market. Angel or its associates/analyst has not received any compensation / managed or
co-managed public offering of securities of the company covered by Analyst during the past twelve months.
This document is solely for the personal information of the recipient, and must not be singularly used as the basis of any investment
decision. Nothing in this document should be construed as investment or financial advice. Each recipient of this document should make
such investigations as they deem necessary to arrive at an independent evaluation of an investment in the securities of the companies
referred to in this document (including the merits and risks involved), and should consult their own advisors to determine the merits and
risks of such an investment.
Reports based on technical and derivative analysis center on studying charts of a stock's price movement, outstanding positions and
trading volume, as opposed to focusing on a company's fundamentals and, as such, may not match with a report on a company's
fundamentals. Investors are advised to refer the Fundamental and Technical Research Reports available on our website to evaluate the
contrary view, if any.
The information in this document has been printed on the basis of publicly available information, internal data and other reliable
sources believed to be true, but we do not represent that it is accurate or complete and it should not be relied on as such, as this
document is for general guidance only. Angel Broking Pvt. Limited or any of its affiliates/ group companies shall not be in any way
responsible for any loss or damage that may arise to any person from any inadvertent error in the information contained in this report.
Angel Broking Pvt. Limited has not independently verified all the information contained within this document. Accordingly, we cannot
testify, nor make any representation or warranty, express or implied, to the accuracy, contents or data contained within this document.
While Angel Broking Pvt. Limited endeavors to update on a reasonable basis the information discussed in this material, there may be
regulatory, compliance, or other reasons that prevent us from doing so.
This document is being supplied to you solely for your information, and its contents, information or data may not be reproduced,
redistributed or passed on, directly or indirectly.
Neither Angel Broking Pvt. Limited, nor its directors, employees or affiliates shall be liable for any loss or damage that may arise from
or in connection with the use of this information.